
A few weeks ago I had the chance to help launch our new "Live with MightyHive" series. My colleague Myles Younger and I chatted about how to distill significance and causality from analytics data, and then how to act on those types of insights. You can watch the full episode and access the slide deck below.
If you want to chat further with MightyHive about advanced analytics solutions like these, please reach out to us at questions@mightyhive.com.
What is significance?
Making decisions based on data needs the support of a robust measure of confidence in the data.
Off the back of an event of some sort (campaign starts, new app feature, global pandemic), if we observe any change in our data we need to be confident the "thing" that happened was actually responsible for the change in data—not just a correlation. We need to be able to demonstrate that had this thing not happened, the data wouldn't have changed.
Then we can infer a causal relationship between the event and the change in the data. Remember—it's still a probability, we can never prove causality in a categorical sense, but we can be highly confident (and it's way better than guessing!). We can remove emotion and unconscious bias from decision-making. We don’t eyeball data or use our gut—mathematics informs the decision making process.
Here's the full chat and slides from last week's "Live with MightyHive" episode (scroll to the end for the slides):
How does it work?
The technology behind the Google CausalImpact R package that was demonstrated in the episode constructs a Bayesian structural time-series model and then tries to predict the counterfactual.
Simply, the mathematical model uses data prior to the event to predict what the data would look like had the event not happened. Important: the prediction is actually a probabilistic range of values. If the historic data is noisy, then the accuracy of the prediction will change. See the screenshot below from the demo walk through linked above. In the image below, the blue shaded area is the prediction (synthetic control estimator) from the model. If the observed data falls outside the blue region, we have significance!
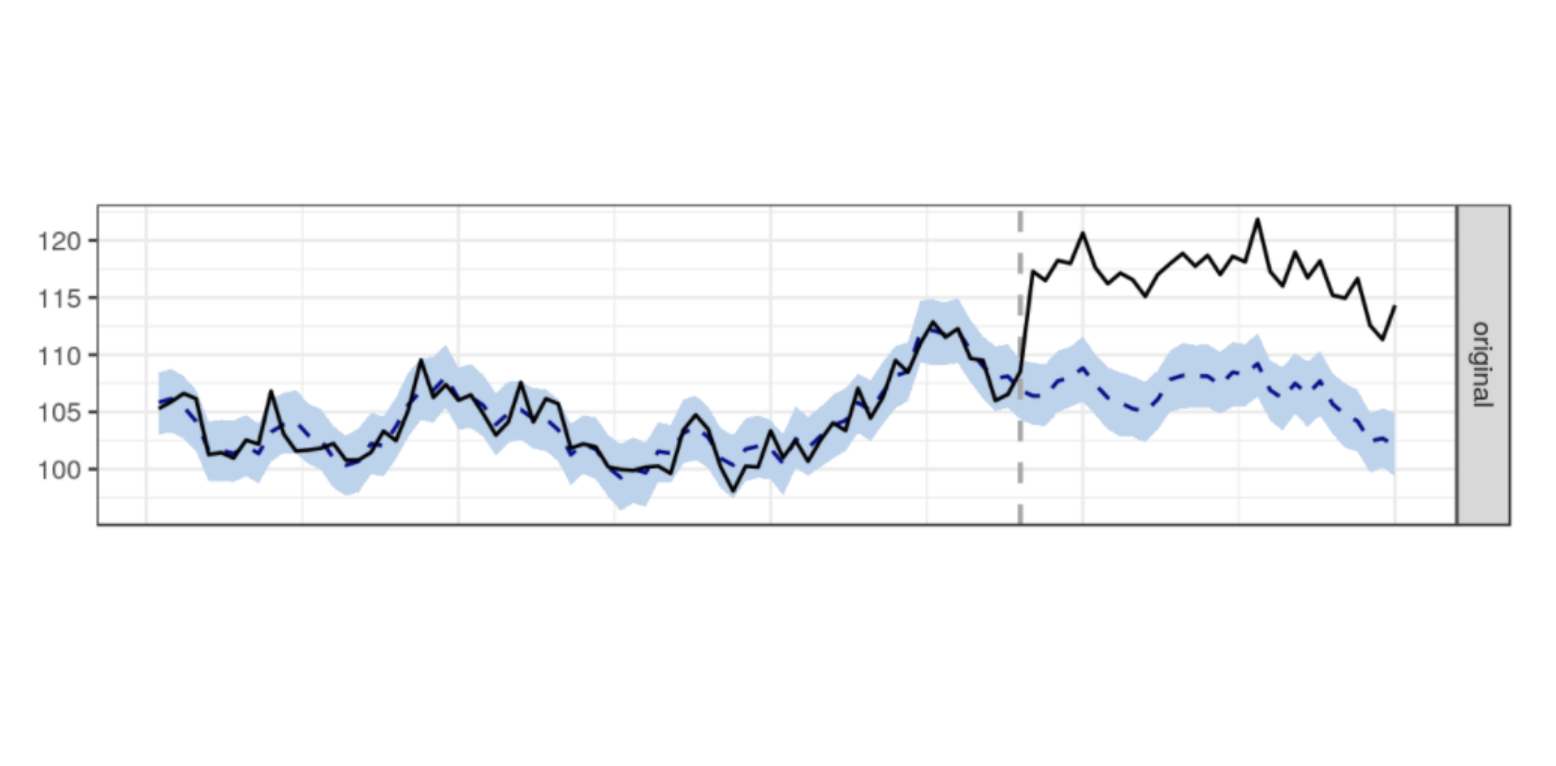
The blue region gets bigger with noisier data. The broader the blue region, the more extreme the observation will need to be in order to achieve a significant signal.
Using Google CausalImpact
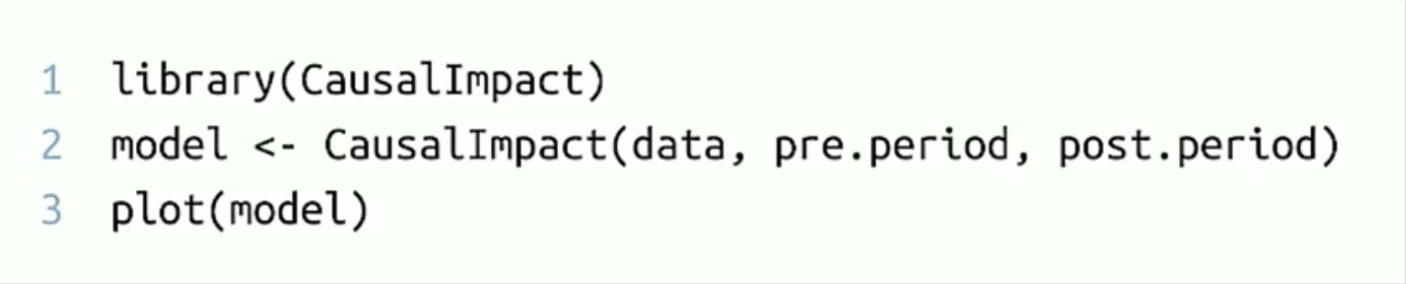
You can use the CausalImpact package with as little as three lines of R. R Studio is open source or you could try it out using rstudio.cloud.
Be advised, if you install the CausalImpact package locally, due to dependencies, you'll need at least v3.5 of R. I updated Linux on the Chromebook to get the latest version of R and R Studio via this very useful article and the package installation was very straightforward.
There's another option thanks to Mark Edmondson from IIH Nordic. Mark wrote a great Shiny app front end for CausalImpact that's free to use, so you can explore significance in your own GA data.
Using significance to establish causality and take action
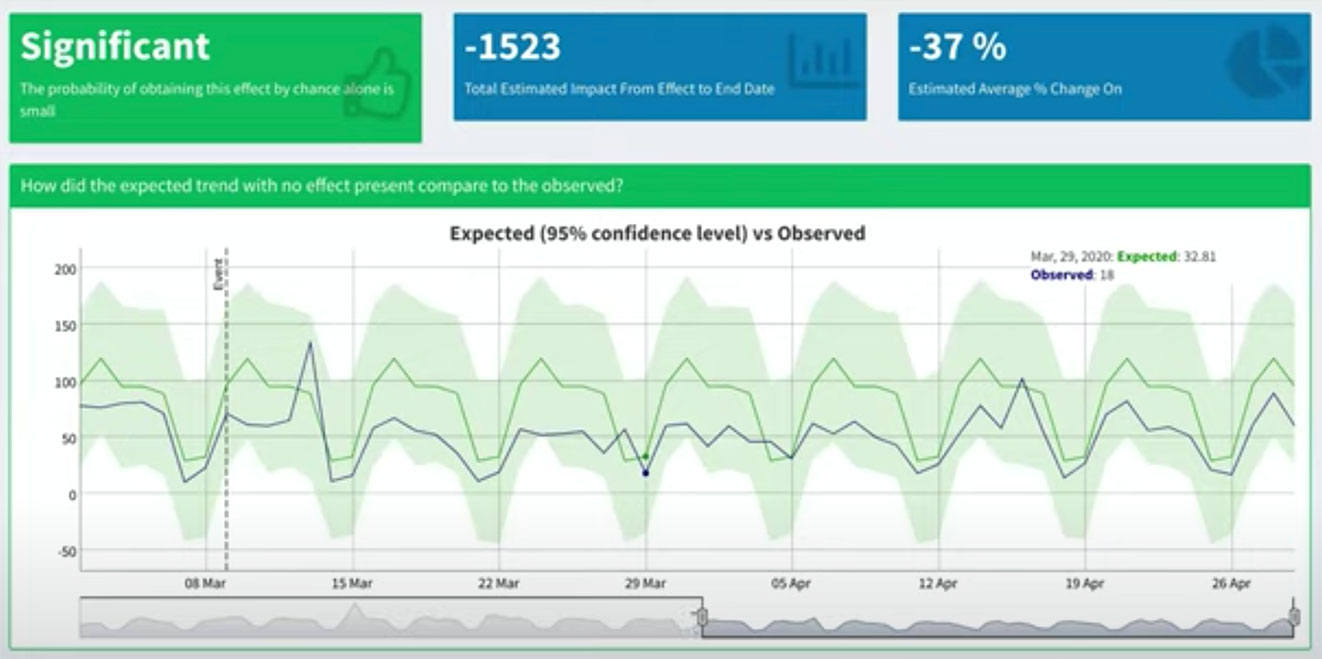
We used the package to analyse client data to confidently answer key business questions that arose regarding KPI changes since the UK was locked down.
As well as considering YTD data (setting the 'event' as Jan 1), we use pre- and post-lockdown (Mar 9) date periods. Data shows clear patterns in purchase behaviour for retails sites. Media sites appear to exhibit explosive growth. However, the specifics regarding growth areas of content are highly informative—not what you'd expect to see by just eyeballing the data from afar.
For retail and media clients, the ability to identify current and future growth areas with confidence is a highly valuable tactic. At a strategic level, the forecast output from CausalImpact is highly actionable in driving campaign content, budgets, and timing.
While tactics for the current global situation include "managing," there is a clear near for preparation as well. Making decisions on current data and using forecasts with confidence proves to be valuable for our clients.
Additional Resources
Thank you for reading! The slides from the episode can be accessed here:
Watch the CausalImpact R package introductory video here (mandatory viewing!):
Remember to sign up here for future Live with MightyHive episodes:
livewithmightyhive.splashthat.com