

We <3 Simo
Last year, our favorite Google Analytics and Google Tag Manager expert, Simo Ahava, wrote a great blog post about How to Build a Google Tag Manager Monitor. This tool is extremely helpful for unlocking statistics on site tag fires from various dataLayer event pushes.
Many crucial data points used for activation and measurement rely on successful dataLayer pushes. We’ve made a few updates to Simo’s Google Tag Manager Monitor framework that have allowed us to join data with Google Analytics. These updates help us unlock the ability to identify stability issue trends and patterns across devices, browsers, and operating systems that can negatively affect dataLayer pushes. For marketers struggling with data leakage, this is a BIG WIN.
We’ve Been Tinkering
Let’s explore the various adaptations we have made to Simo’s methodology in order to join results from the Google Tag Manager Monitoring Tool with a Google Analytics dataset in BigQuery, and what these enhanced capabilities mean for marketers. The join we’ve created enriches data collected via the Google Tag Manager Monitoring Tool with Google Analytics data points such as device, browser, OS—crucial information in understanding trends and patterns that impact performance.
This post provides a high-level overview for how adding a new metric to your analytics toolset can help you measure the stability of your analytics implementation. If you’re interested in digging deeper into specifics or discussing real-world use cases, please reach out to me.
TECH SETUP
There are a few prerequisites to have in place before joining data from a Google Tag Manager Monitoring Tool with Google Analytics data:
- Pre-existing implementation of Simo’s Monitoring Tool (use his guide to get started)
- Access to Google Tag Manager
- Access to Google Cloud Platform project
- Google Analytics 360 Export
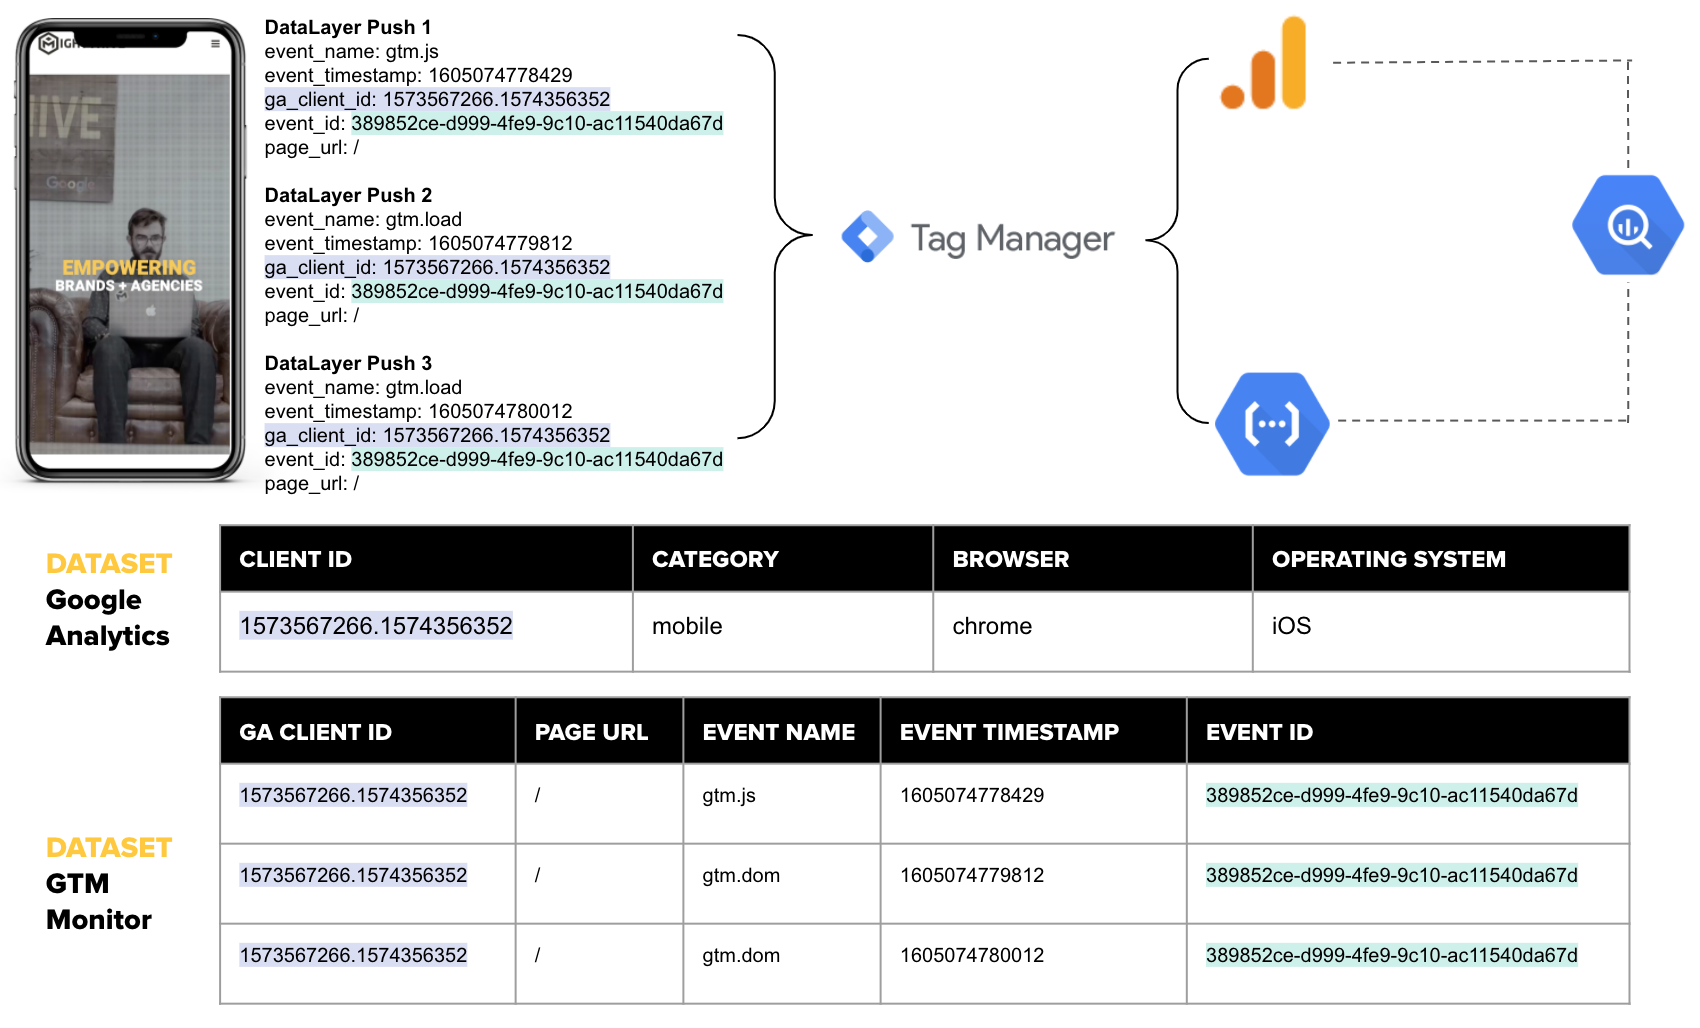
Here’s a look at an architecture diagram showing the Google Tag Manager Monitor Tool integrated with Google Analytics:
The Secret Sauce
The MightyHive Data Science team has designed a series of updates to Simo’s monitoring tool to provide enhanced data and diagnostic insights, including updates to the tool template to capture the Google Analytics Client ID, allowing us to join Google Analytics BigQuery data sets. Our team also realized that to connect all events on a given page together, a universally unique identifier (UUID) needed to be set via a new custom HTML tag.
With the updated Monitor Tool template and the UUID tag set, the team updated the Cloud Function and created a BigQuery Table Schema for the enhanced tool using three additional fields: ga_client_id, event_id, and urlpath.
For a more detailed breakdown of the custom HTML tags we used, key Google Tag Manager settings, and code snippets for the template updates, shoot me an email.
What Does this Look Like IRL?
A client—let’s call them Company X—published a new version of their site around August 3. Once the updated site was live, Company X noticed that the gtm.load dataLayer event push began to fire later, or in some cases not at all. Because various tags were set to fire on gtm.load, those tags fired less frequently post-release.
Tracking breaks like this are a marketer’s nightmare. Did the tag fail? Did someone publish an update with broken code or without the all-important dataLayer push? Is the break happening on a specific device, browser, or operating system? These questions and more can lead to a frustrating, time consuming wild goose chase, not to mention lost data until the issue is fixed.
Calculating the Google Tag Manager Load Rate
To troubleshoot Company X’s misfire, we used a new metric: Google Tag Manager Load Rate. We’ve calculated the load rate using the following simple formula:

Let’s say Company X has an order confirmation dataLayer event that occurs after gtm.js. Swapping out gtm.load for the order confirmation dataLayer event gives Company X its order confirmation fire rate.
BIGQUERY GOOGLE TAG MANAGER LOAD RATE QUERY
The Google Tag Manager Load Rate query calculates the fire rate in the following grouping:
- Device Category - Google Analytics provided device category (desktop, tablet, mobile)
- Device Browser - Google Analytics provided device browser (Chrome, Safari, Firefox)
- Page Path - Page where the event occured
- Load Count - Count of gtm.load events
- JS Count - Count of gtm.js events
- GTM Load Rate - Load Count / JS Count
Here’s what the query output looks like:
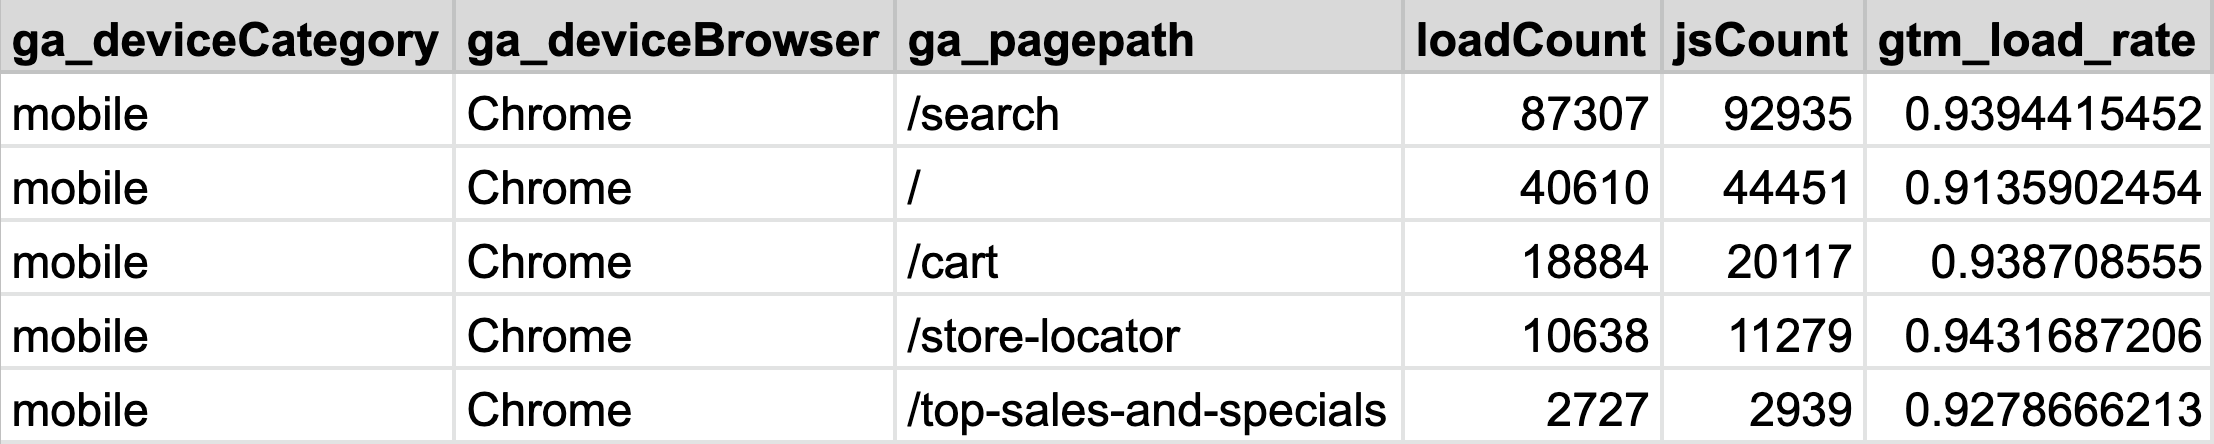
In this example, using our BigQuery Google Tag Manager Load Rate query, we can quickly see that Company X’s home page, or “/”, has the lowest load rate at 91%. This means that 9% of gtm.loads on the home page did not fire, therefore leading to 9% (!!!) of traffic potentially being untracked.
Better Insights, Faster Solutions
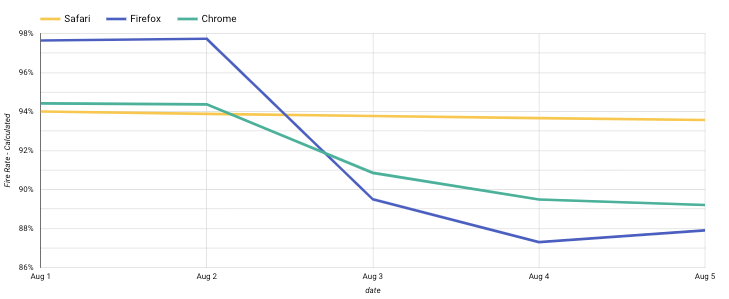
Our updates to the Google Tag Manager Monitoring Tool help take some of the guesswork out of the equation by automating a solution that audits dataLayer fires to quickly diagnose issues as they arise. By leveraging our version of the tool supplemented with Google Analytics data points, Company X was able to quickly pinpoint a sharp decline in fire rates post-release on Chrome and Firefox, while Safari was unaffected. A speedy and definitive diagnosis helped Company X fix the issue fast, reducing data leakage and bolstering its analytics setup against future issues.
Data Leakage Be Gone!
In advanced analytics use cases, troubleshooting and diagnostics can monopolize an inordinate amount of time and resources, risking massive data leakage until an issue is resolved. Now that we have the ability to join Google Tag Manager Monitor Tool insights with Google Analytics datasets, we can pinpoint when and where dataLayer pushes fail and which devices, browsers, and operating systems they are failing on. For marketers, this means hours, days, or even weeks of time saved and minimal data lost.
Interested in learning more? Email me at jack.pace@mightyhive.com.