

Aligning marketing spend with business objectives is a top priority for marketers. Now is the time for organizations to identify analytics solutions that provide a single view of the customer's journey, allowing more informed predictive modeling and data-driven audience segmentation.
This post will evaluate Google Analytics 360 (GA 360) attribution capabilities and identify different ways organizations can select the attribution models that align most closely with their KPIs and customers' journeys.
What Events is Google Analytics 360 Attribution Measuring?
Google has the largest deterministic cross-device graph which allows marketers to anonymously observe conversions from signed-in users. If a user is logged into Gmail and interacts with an ad served by Google, marketers can measure that user across multiple devices (e.g., desktop, mobile) along their path to conversion. Users are also verified across marketing touchpoints if they are logged into YouTube, Google Maps, or any other Google-owned product.
Google Analytics 360 Attribution Feature Comparison
It might be tempting to compare only the attribution modeling features of Google Analytics Standard and Google Analytics 360, but sophisticated attribution modeling relies on a comprehensive set of technology and data sources. With access to fresher and more granular data, and integrations into Google Marketing Platform, Google Cloud BigQuery, and Salesforce, GA 360 gives marketers a powerful set of tools for building attribution insights.
| GOOGLE ANALYTICS STANDARD | GOOGLE ANALYTICS 360 | |
| Attribution modeling | ✔ | ✔ |
| Data-driven attribution | ✘ | ✔ |
| Display & Video 360 integration | ✘ | ✔ |
| Search Ads 360 integration | ✘ | ✔ |
| Salesforce integration | ✘ | ✔ |
| Unsampled reporting | ✘ | ✔ |
| BigQuery integration | ✘ | ✔ |
How to Start Using Google Analytics 360 Attribution
To provide an overview of GA 360 attribution features, we'll cover how to get started in three key areas:
- Grouping your digital channels
- Comparing attribution models
- Using data-driven attribution
Grouping Your Digital Channels
By default, GA 360 creates a Default Channel Grouping, which could include traffic from direct sources, organic/paid search, social, email, affiliates, referral, display, and other advertising channels, but there are a few limitations and caveats to note about custom channel groupings. By manually tagging URLs with UTM parameters, marketers can create custom groupings, but not all channels will query cost data as a dimension, including paid social sites like Facebook.
Importing cost data from non-Google campaigns (e.g., email and social), combined with conversion and e-commerce data, allows marketers to determine ROAS (Return on Ad Spend) for each activity. Marketers also have the option of classifying paid search queries as Brand vs Generic to analyze performance metrics separately as the investment across each activity could differ significantly.
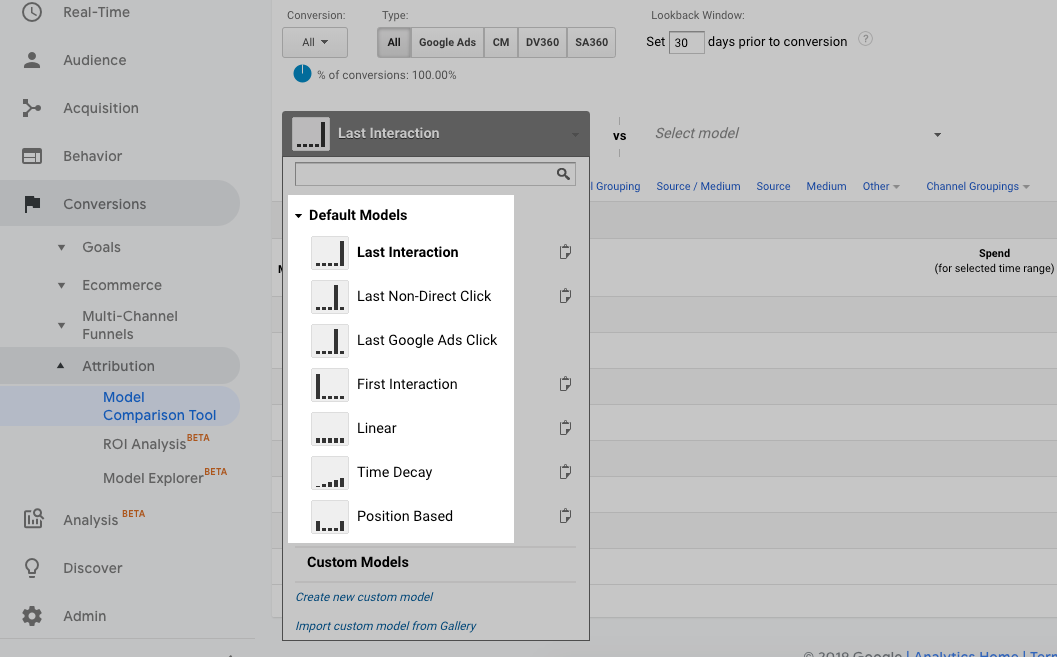
Comparing Attribution Models
Once each channel has been tagged and added to its default or custom grouping, marketers can leverage the Model Comparison Tool to analyze site visitors based on specific conversion goals. GA 360 is equipped with seven default attribution models, each with a particular set of rules for determining how credit for sales and conversions is assigned to touchpoints along with conversion path.
87% of paid advertising and marketing teams leverage the same integrated technology stacks, underscoring the importance of unifying data to assess real-time customer engagement. In turn, this will allow marketers to determine whether investment in each tagged channel drives measurable business impact based on their marketing mix.
Using Data-Driven Attribution
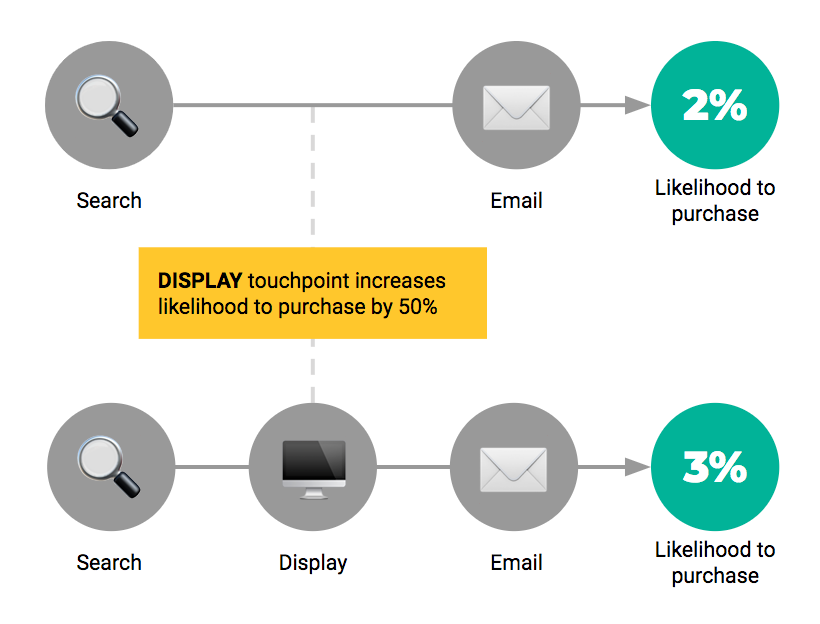
GA 360 also includes a custom Data-Driven Attribution model. This additional model not only analyzes path data to develop custom conversion models, but also algorithmically assigns partial credit to marketing touchpoints based on the Shapley Value. This cooperative game theory is an approach to fairly distribute the output of a team among the constituent of team members. For example, Paid Search preceding Email is modeled separately from Email preceding Paid Search.
How Data-Driven Attribution Uses the Shapley Value
In order to use Data-Driven Attribution, marketers must meet the following conversion thresholds for the previous 28 days:
- 400 conversions per conversion type, with a path length of 2+ interactions (i.e., 400 conversions for a specific goal or transaction, not a sum of 400 overall conversion types); AND
- 10,000 paths in the selected reporting view (roughly equivalent to 10,000 users, although a single user may generate multiple paths)
Find the full GA 360 data-driven attribution requirements here.
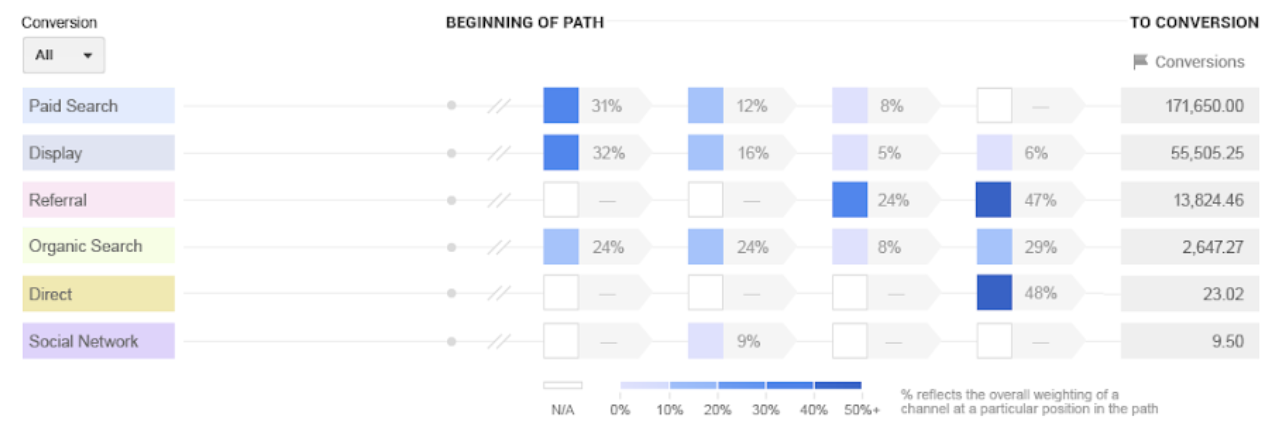
The Model Explorer Tool
After the model has been created, marketers can leverage the Model Explorer tool to discover the weights assigned to specific channels and their position along the user's path to conversion. Data-Driven Attribution will incorporate a maximum of four interactions, clicks, and direct traffic, within a 90-day look-back window of a conversion. According to Google, the last four interactions comprise more than 85% of conversions, which is why the Multi-Channel Funnels Path Length report allows marketers to review the entire path length, along with the option to create custom funnels.
Within the Model Explorer tool some channels, like Direct, may not occur and are represented with a dashed (-) line and white color label, as shown below.
GA 360 Attribution is Just One Part of a "Complete Breakfast"
Across each stage of the customer journey, whether it be brand-building, lead generation, or even customer advocacy, marketers must determine which channels drive measurable impact. Increases in mobile web traffic challenge marketers to invest in new video formats as cable cutters rejoice the rise of apps like Netflix. Teams must also consider the growing impact of trends like IoT on traditional formats like billboards and television, which still lead in brand building because of scale. Some may argue that social marketing deserves consideration throughout the customer journey while others may find success with email marketing for direct engagement.
At MightyHive, we understand that analytics is the backbone of a unified customer journey. Our solutions team helps marketers unlock the power of Google Analytics 360 and the rest of the Google Marketing Platform stack to bring marketing channels, customer data, and insights together into a single view of the customer.